Regression in AI
What is Regression in AI?
The mathematical approach to find the relationship between two or more variables is known as Regression in AI . Regression is widely used in Machine Learning to predict the behavior of one variable depending upon the value of another variable.
Unlike the classification models, the regression models output numeric values. It also has continuous values for both dependent and independent variables, and for the most part, Regression is classified as supervised learning.
Types of Regression in AI
Each regression technique has some assumptions that you need to fulfil before using them. Here are a few of the types ranging from famous to less known; each of them has its own pros and cons.
- Linear Regression: Linear Regression is considered to be the simplest form of Regression. This type of Regression is applicable when the relationship between the dependent and independent variables is linear in nature. The data is plotted on the graph, and a best-fitted line is calculated using the formula. This line is also known as the line of Regression. The predictions are then made on the basis of this line.
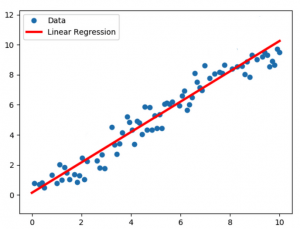
The graph shows the linear regression model that is fitted on a data set represented by blue dots. For a simple linear regression, the equation is as follows
y=mx+c
Here ‘y’ is the dependent variable, ‘x’ is the independent variable, ‘c’ is the y-intercept of the line of Regression, and ‘m’ is the regression coefficient/slope of the line. If the number of independent co-efficient increases than the formula is as follows
y=m1 x1+m2x2+m3 x3…….mn xn+c
The slope of the line can be calculated using the simple slope formula
slope= x2–x1y2–y1
After calculating the ‘m’ and ‘c’ for the Regression, we calculate the mean square error (MSE) and minimize it using gradient descent. MSE is given by
MSE= 12Ni=1n(yi –(m1 x1+m1 x1+m1 x1) )2
Here ‘N’ is the number of data points, two is multiplied to facilitate when taking derivatives. This MSE is minimized, and the slope is adjusted using gradient descent.
- Logistic Regression: Logistic Regression is used to predict the probability of a particular variable on the basis of independent variables. This regression model is mainly used in classification problems like detecting spams email, diseases, and cancer detection.
Mathematically, this model predicts the probability of an individual variable ‘Y’ on the basis of the independent variable ‘X’. The graphical representation of Logistic Regression is similar to that of a sigmoid function. There are generally three types of logistic Regression
- Binary
- Multinomial
- Ordinal
There is a minor difference between all three of these types. In binary logistic regression, there are two possible types of output, i.e., 0 or 1. It is more like a classification model, and 0 or 1 may represent yes/no, success/failure, etc. In multinomial and ordinal logistic Regression, there are three or more possible outcomes. The only difference is that the multinomial has an unordered type and ordinal has ordered type of outcome.
The mathematical formula for a simple binary logistic regression is given by
gz= 11+e-z
Here ‘z’ is the hypothesis, which is assumed to be
z=W*X+B
The cost function of this Regression is given as follows
costgz,y(actual)= {–log gz if y=1 –log 1-gz if y=0
- Ridge Regression: It is the type of Regression in which we add a plenty term equal to the summation of the square of the regression coefficients. This term is added to the cost function, and it helps us reduce the complexity of the model and also prevents the overfitting problem, which occurs due to simple Regression. Overfitting occurs when the model performs well for the training data, but the results on testing data are not satisfactory.
Mathematically the cost function is expressed as
i=1Myi–yi2=i=1Myi–j=0pwi–xij2+j=0pwj2
Here λ acts as the regularization parameter, which is always a positive number. It must be noted that there is no plenty applied to the intercept term. Only the summation of the square of the regression coefficient is affected by it.
Choosing the value for the regularization parameter (λ) is also very important. If we decide λ=0, then the plenty term will get excluded, and if the value of λ is kept high, then it will result in under-fitting. To find the optimal value, we plot the parameter against the different values of λ and select the minimum value for which the parameter is stable.
- Support Vector Regression: When a support vector machine is used in the regression model, it becomes support vector regression (SVR). These types of regression models help us to define a boundary for an acceptable amount of error and find a hyperplane to fit the data. The SVR minimizes the coefficient rather than minimizing the squared error as done in other regression models.
The cost function to minimize is
min(12|w|2)
Constraints are as follows
yi–wixi≤e
We can also add a slack variable to the cost function in order to obtain better results.
- Decision Tree Regression: The decision tree regression works on the principle of standard deviation. In order to understand the standard deviation, we need to understand the variance. Variance is defined as the average of the squared distance of each value from the Mean value.
By taking the square root of the variance the deviation can be calculated . In decision tree regression, the main aim is to reduce the standard deviation by segmenting the data into independent variables.
How to choose the best model?
There are many other models of Regression in AI other than the described above. But in order to choose the best one, we need to consider the following points
- If the dependent variable is continuous and the resulting model has collinearity, then you should go for the ridge, lasso, or elastic net Regression. The final model can be selected on the basis of r-square error or RMSE.
- Support vector regression is the best choice when dealing with non-linear models
- The cross-validation method is handy to eliminate the overfitting issue. Ridge and lasso models can also be used to reduce the overfitting problem
- For count data, it is a better choice to use negative binomial Regression
- Compare linear regression models for the same dataset
- Find a model with a more adjusted R2 value
- Errors of the model should be within a small bandwidth